The Trap Rock River Watershed Encompasses approximately 29,528 acres and is located in northern Houghton and south eastern Keweenaw counties. Major land uses, in descending order, include forest, wetlands, urban, agricultural, and miscellaneous. The watershed's main channel, the Trap Rock River, is a major tributary to the Keweenaw Waterway, which connects to Lake Superior through Torch Lake and Portage Lake.
Since this is a rather small watershed, little information was found about it. What facts that I developed are:
The watershed has approximately 54.6 miles of river, stream or intermittent streams and one lake. The elevation of the Trap Rock River goes from 610 feet at the mouth to 1194 feet at the outlet of Calumet Lake.

In a roadside park past Mohawk is a much photographed Snow Gauge that is a mile or two north of the northern edge of this watershed. It records Mohawk's annual cumulative snowfall, often 250 inches. I the winter of 1978-79 a record setting snowfall of 390.4 inches was recorded. Much of this snowfall is lake effect. My dad who grew up in Lake Linden took a picture of my grandfather shoveling a +2 foot snowfall off of the garage roof. The existing accumulated snow was a foot or so below the eves. He also had a picture that showed a tunnel to gain entry to their house that had at least a four foot roof of snow. Point being is they get a lot of snow in the Keweenaw peninsula.
The watershed for the Trap Rock River occupies a small valley with highlands on both sides. To the east the highlands reach up nearly 300 feet higher then the river's mouth. The west rises even higher to over 500 feet. With this steep elevation change and the fact that the Keweenaw peninsula can gets an average of 250 inches of snow, this can lead to a massive spring thaw. This gaging station can then warn officials of the rising water levels.
The USGS
Investigates the occurrence, quantity, quality, distribution, and movement of surface and underground waters and disseminates the data to the public, State and local governments, public and private utilities, and other Federal agencies involved with managing our water resources.
The web site USGS Water Data for the Nation provides online access to water-resources data collected at approximately 1,516,137 million sites in all 50 States, the District of Columbia, and Puerto Rico. These collection sites are: Surface Water: Water flow and levels in streams, lakes, and springs. (least number of sites.) Ground water: Water levels in wells. (2nd highest number of sites) Water quality: Chemical and physical data for streams, lakes, springs, and wells. (most number of sites)
Data is collected by field personnel through manual measurements or by automatic recorders relayed through telephones or satellites to offices where it is stored and processed. The data relayed through the Geostationary Operational Environmental Satellite (GOES) system are processed automatically in near real time, and in many cases, real-time data are available online within minutes.
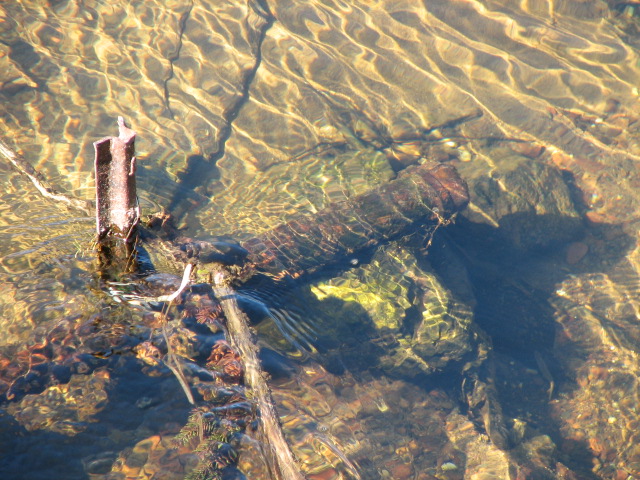
Gage stations use various methods to collect their data. This one as most I've seen uses an ultrasonic sensor that bounces sound waves off of the water's surface to determine the level of the water. Knowing the river's channel shape and dimensions the volume of discharge can be determined. If you look just north of the bridge you will notice a rusted pipe below the river's surface. The angle of this pipe may suggest that it was once used as another way to measure the river's level.
The collected data can be used to warn communities of potential flooding. The data can also be used to regulate the flow of rivers by the control of dams located in the watershed. There are no dams on the Trap Rock River so no control is possible. The only town that could be affected by the flooding of the Trap Rock River is Lake Linden. This town is where by dad was born and raised so the area is special to me.
NOAA (the National Oceanic and Atmospheric Adminisrtation) also provides online data for this gaging station. That data can be found here. From their web site they have listed the following collected data:
Flood Categories (in feet)
| Major Flood Stage: |
12.5 |
| Moderate Flood Stage: |
11 |
| Flood Stage: |
8.5 |
| Action Stage: |
7 |
|
Historical Crests
| Date |
Height |
| 05/10/1979 |
10.72 ft |
| 03/30/1998 |
10.53 ft |
| 04/21/2001 |
10.39 ft |
| 11/16/1988 |
10.11 ft |
| 08/17/1988 |
9.95 ft |
| 05/12/2003 |
9.87 ft |
| 04/25/1982 |
9.67 ft |
| 04/19/2004 |
9.57 ft |
| 05/02/1972 |
9.30 ft |
| 04/16/2002 |
9.28 ft |
|
In 1889, the USGS established its first gaging station in Nevada and began providing data to the public about Nevada’s water resources.
Logging requirements:
Using this web site send me an email with the following information:
1.) What was the "Discharge, cubic feet per second" at the time of your visit?
2.) What was the "Gage height, feet" at the time of your visit?
3.) What was the weather like at the time of your visit? (Meaning clear, raining, snowing, spring thaw)
4.) What was the condition of the Trap Rock River's water? (Meaning clear, muddy, frozen, etc.)
5.) Photos can not be required as a requirement to log a find on an Earthcache. With that said, photo(s) are always appreciated. Your face does not need to be in the photo.