On July 24, 2009, parts of the City of Ottawa experienced a significant rainstorm (over 100 mm of rain in a 24-hour period in some areas) resulting in nearly 1,500 flooded basements. Sewer backups, overflows at two sewage pumping stations and seven culvert failures are some factors that contributed to the floodings. Most of the flooding occurred primarily in the City’s west end, mainly in Ward 4 - Kanata North (Beaverbrook), Ward 5 - West Carleton-March (Carp Village), Ward 6 - Stittsville, and Ward 23 - Kanata South (Katimavik and Glen Cairn). An investigation, led by the Infrastructure Services Department (ISD) and supported by several City departments, was initiated to understand why flooding occurred, what can be done to reduce the risk of future occurrences and to implement solutions.
The investigation was carried out in five phases:
Phase 1 - Background data collection,
Phase 2 - Assessment and problem definition,
Phase 3 - Identification and evaluation of alternative solutions,
Phase 4 - Development and approval of action plan
and Phase 5 - Implementation of approved action plan. The scope of the investigation included all west end locations that experienced flooding. The focus was on affected areas where flooding resulted in damage to private properties or to City infrastructure. While heavy rainfall and flooding also occurred in other parts of the City, flooding in other areas appears to be isolated and dispersed. These isolated cases are subject to a separate investigation on an individual basis.
HOW IS CATTAIL CREEK INVOLVED?
High water level in Cattail Creek at Katimavik Road:
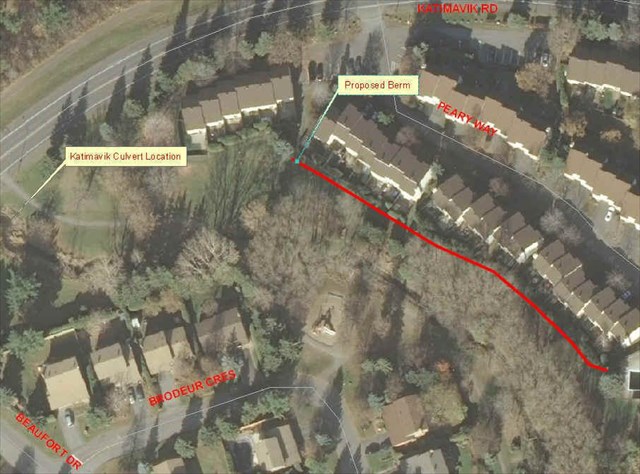
On July 24 2009, high water levels were reported in Cattail Creek at Katimavik Drive. Debris, transported as a result of the storm, partially clogged the grate of the culvert crossing Katimavik Road causing water to back into the yards of properties along Peary Way and enter basements through window wells and joints around basement floors.
Recommended solution:
A hydraulic assessment was carried out to determine the capacity of the culverts and resulting water levels in Cattail Creek during large infrequent rainfall events. It was found that with the culverts entrance free of debris, the existing culverts have sufficient capacity, although water levels do approach backyards. Creating a berm in the backyards along Cattail Creek, south of Katimavik, is recommended. During detailed design of the berm, the need for grating at the Katimavik culvert inlet will be reassessed. The picture below depicts the recommended solution.
TO LOG THIS CACHE...
EMAIL ME THE FOLLOWING:
1. Calculate the discharge rate of a certain section of the creek. Us the part close to the posted coordinates (The pint where wter comes out of the drain).
2. In between the posted coordinates, and the first bridge you see, find the deepest part, and the shalowest part, and send me their coordinates, and an estimate of how deep (in meters or feet) that part is.
3. What do you think that the city of Ottawa can do (besides what was suggested in the text above) to help prevent future flooding at Cattail Creek?
4. **OPTIONAL** Take a picture of you, and your GPSr at Cattail Creek.
Do not wait for my response to log this. If you're answers have something wrong with them, then your logs will be deleted, and I will contact you to correct it. DON'T POST YOUR ANSWERS IN YOUR LOGS!
Any logs with answers/spoilers will be deleted.
How to calculate the river discharge (Average velocity):
The velocity of the water within a river channel varies according to depth and nearness to obstacles such as the bed, banks and boulders which generate friction and drag. If you have recorded the surface velocity, a good estimate of the average can be found by multiplying your surface value by 0.8. For example, a surface value of 3 meters per second would be converted thus...
Measured surface value x 0.8 = average velocity
3.0ms x 0.8 = 2.4 ms
If you have carried out a detailed survey of velocity throughout the cross-section, using a velocity meter ( flow vane ) you can plot your readings on graph paper and work out the average velocity from that. Either way, don't forget to ensure that for the final discharge reading you use the correct units for area and time - meters and seconds.
Cross-sectional area Now for the cross-sectional area. Having recorded all your depth data in the field you will probably be intending to plot it on graph paper to produce a cross-section diagram. Once this has been drawn it is possible to find the area simply by counting the number of squares in the 'wet' part of the diagram. This works quite well for small streams but the number of squares on the graph paper rapidly goes into the hundreds and even thousands. Keeping an accurate record of which ones you have counted is difficult without marking them on the actual diagram. This may not be desirable if you want to display the diagram afterwards.
Happy caching,
Greg